
Avalara Commerce Monitor
January–October 2020

Introduction
Welcome to our first edition of the Avalara Commerce Monitor — analysis from the Avalara index tracking system that monitors segments of the United States economy. This edition looks at transaction data from January 2020 to October 2020.
The Avalara Commerce Monitor is made up of three indices, one for each of the following industry verticals:
Manufacturing
Retail
Services
The indices are representative of the country with equal distribution across four key U.S. Census regions: Northeast, Midwest, South, and West. The Avalara Commerce Monitor will bring you regular insights from the previous months to benchmark and highlight trends in consumer spending and economic performance.
Due to the global pandemic, consumer spending and business operations have been anything but normal in 2020. We’ve watched lockdown orders close storefronts for months, while ecommerce and online purchases skyrocket across industries. Despite the volatile nature of the economy, we’ve seen numerous trends accelerate throughout the year, including the adoption of ecommerce, at-home subscriptions, and more.
The Avalara Commerce Monitor found that total sales from the beginning of May through September across manufacturing, retail, and services sectors all increased (by 32%, 12%, and 28%, respectively). Despite the loss of supplemental federal benefits in August and a subsequent decline in personal income across the U.S., all three sectors have maintained growth in total sales with each seeing higher September 2020 sales percentages than September 2019.

Our Manufacturing Index shows that the Midwest continues to be the strongest region for total sales and items sold within the industry. Our Retail Index shows that sales have steadily climbed since April despite a slight falter in August when consumer spending slowed and additional relief dollars were suspended. Our Services Index reflects the tumultuous nature of infection rates across the U.S. with peaks and valleys in total sales coinciding with upticks in COVID-19 cases.
Definitions
Indices
The Avalara Commerce Monitor Manufacturing Index includes businesses that engage in the mechanical, physical, or chemical transformation of materials, substances, or components into new products. Examples include medical equipment manufacturing, sign manufacturing, pharmaceuticals, plastics, and commercial machinery.
The Avalara Commerce Monitor Retail Index includes businesses that engage in retailing merchandise. Examples include electronics, home furnishing/furniture, sporting and recreational goods, clothing, office supplies, cosmetics, jewelry, office equipment, and grocery.
The Avalara Commerce Monitor Services Index includes businesses that provide services to their customers and no physical goods are transferred from the seller to the buyer. Examples include advertising, computer programming/systems design, administrative management, scientific and technical consulting, and interior design.
Terminology
The following company performance metrics are used in the aggregated data reported by the Avalara Commerce Monitor:
Items sold: the total number of items sold for all transactions processed by Avalara
Total sales: the sales amount in dollars for all transactions processed by Avalara
Churn rate: the percentage of lost customers over a set period of time

Key findings
1.
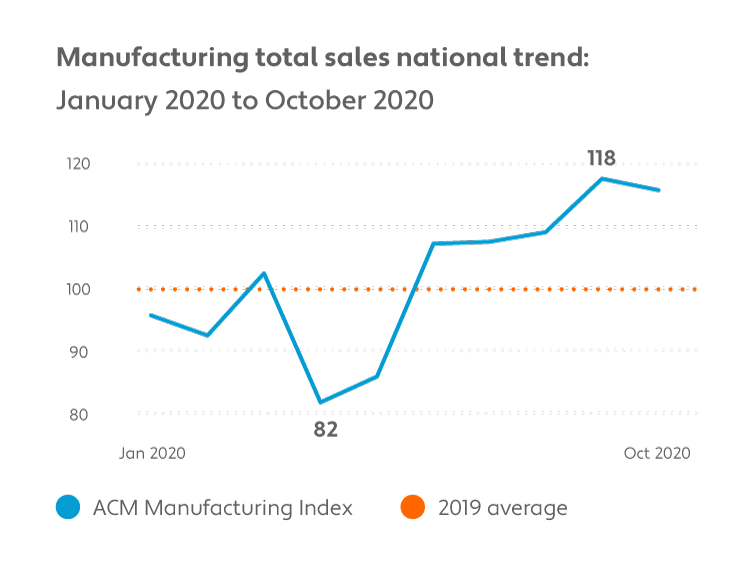
Manufacturing total sales reached its highest levels this year in September.
Manufacturing is a leading indicator for the holiday season. This year, the total sales across manufacturing reached 18% above the baseline in September, which may be attributable to retailers preparing inventories for holiday promotions beginning in October.
2.
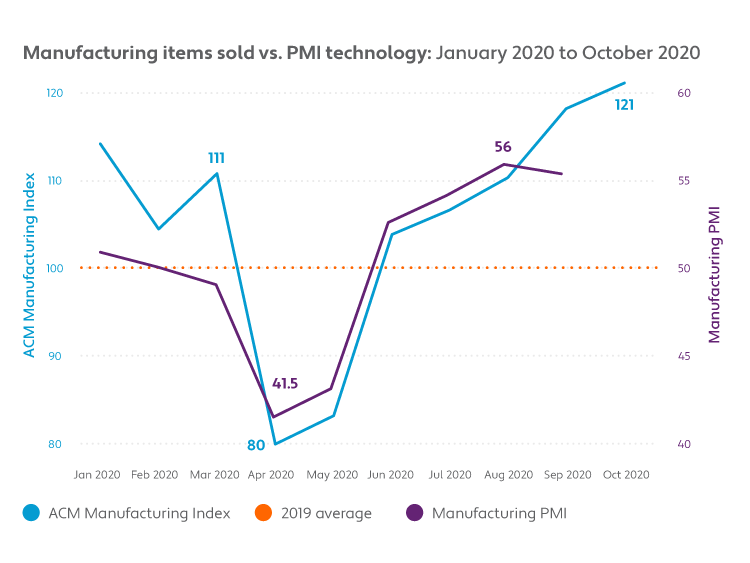
Manufacturing has proved to be most resilient since the onset of the pandemic, according to the Avalara Manufacturing Index.
Total items sold for manufacturing saw the smallest decrease since the onset of the pandemic and saw the highest increase in the three indices through October.
3.
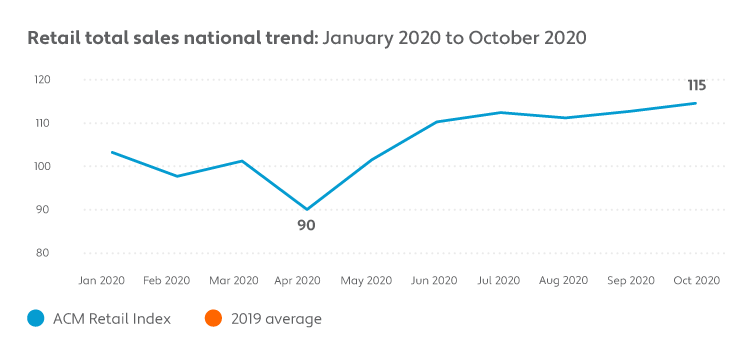
With the holiday season starting earlier, the Avalara Retail Index found that total retail sales reached a year high in October.
Major online holiday shopping sales began in October — coinciding with the highest total retail sales this year. Total retail sales were also up as much as 7% year over year in October.
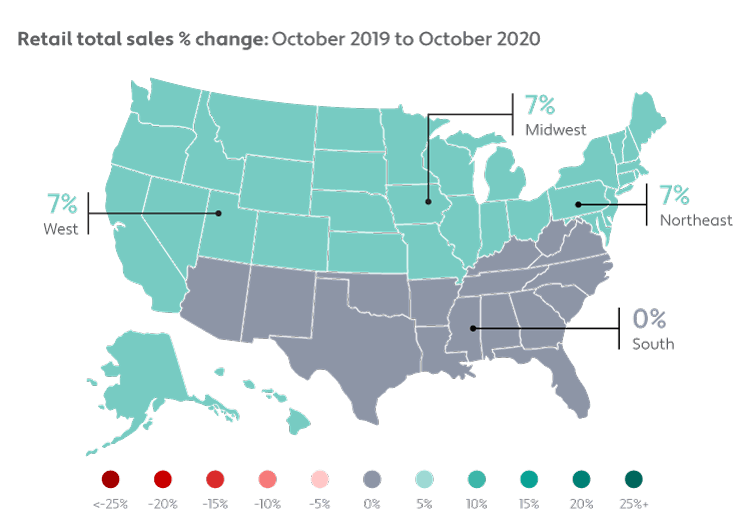
| Region | % change | October 2019 | October 2020 |
|---|---|---|---|
| Midwest | 7% | 112 | 120 |
| West | 7% | 107 | 114 |
| Northeast | 7% | 106 | 113 |
| South | 0% | 113 | 113 |
4.
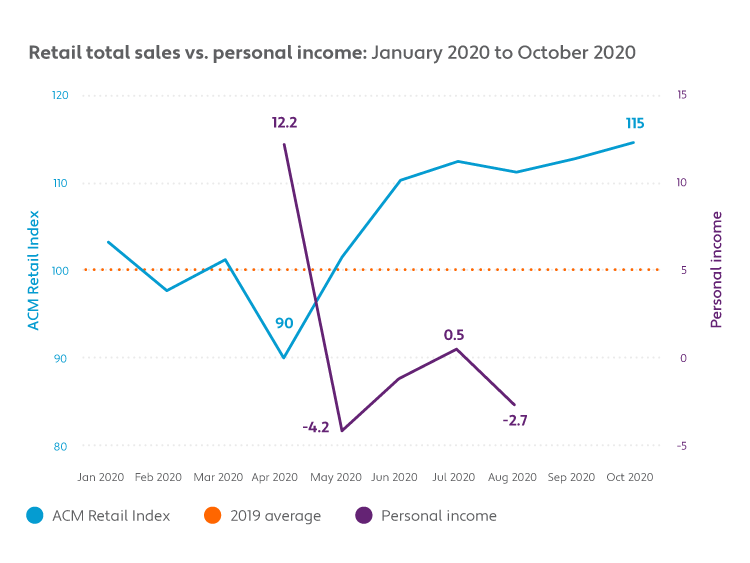
The Avalara Retail Index shows total retail sales dropped in August alongside a drop in personal income.
The U.S. Bureau of Economic Analysis reported the 2.7% drop in personal income following the expiration of a weekly $600 federal supplement to unemployment benefits.
5.
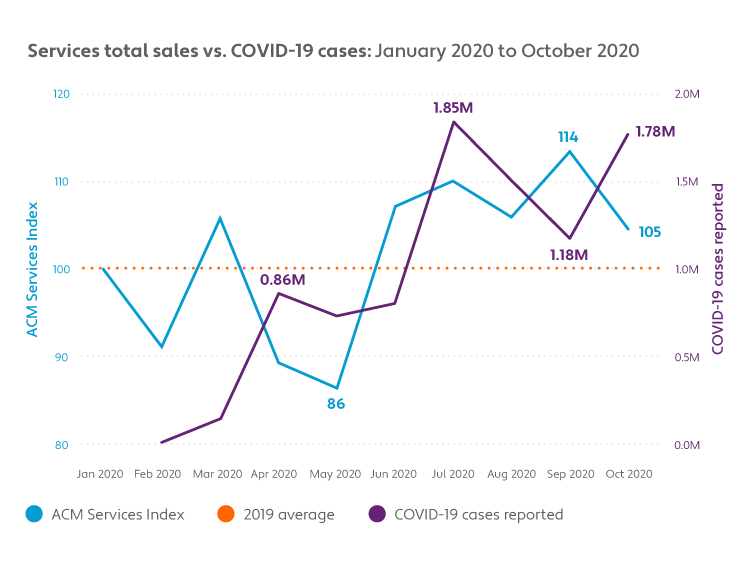
The Avalara Services Index shows drops in total sales following surges in COVID-19 cases between March and October.
Following surges in COVID-19 cases in both April, July, and October, total services sales decreased nationwide each time.
6.
The Avalara Services Index shows that total sales year over year showed little change across the U.S.
Total sales changed no more than 1% year over year in October 2020.

| Region | % change | October 2019 | October 2020 |
|---|---|---|---|
| West | 1% | 104 | 105 |
| Midwest | 0% | 100 | 101 |
| South | 0% | 107 | 108 |
| Northeast | -1% | 103 | 103 |
Index summaries
Avalara Manufacturing Index
Avalara data shows manufacturing sales rebounding after May as the industry adapted to COVID-19 protocol and states began reopening.
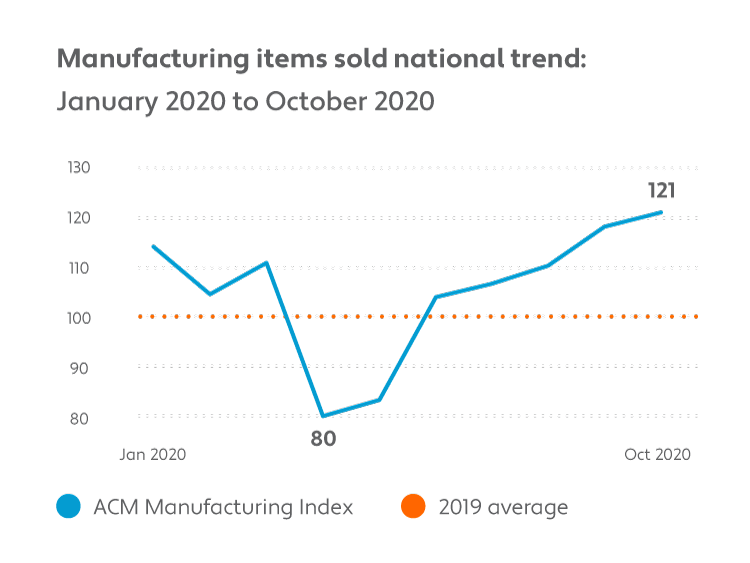

When the pandemic hit the U.S. hard in March, manufacturers had to quickly rework their facilities to allow for social distancing and monitoring for COVID-19 spread within the facilities. Because of the limitations of in-person work, the sector saw a significant slowdown in transactions — decreasing by 18% from the baseline in April. After April, total items sold in manufacturing began to steadily increase. According to the Manufacturing ISM Report on Business, some manufacturers cited that they were able to ramp back up to full production beginning in May, which had a positive impact on sales.
Following steady sales numbers from June through September, the Avalara Commerce Monitor Manufacturing Index saw a year-to-date high in total manufacturing total sales in September — up 18% from the baseline and outpacing sales year over year from October 2019. The peak in September can be tied to the kickoff of the holiday shopping season, which began earlier this year with major online sales happening in October.
While manufacturing total sales declined in October, the number of items sold (the total number of items sold for all transactions processed by Avalara) across manufacturing steadily increased from May and peaked in October (up 21% from the baseline).
When comparing total manufacturing sales in March to October, all U.S. regions saw an increase in total sales. However, the Midwest and Northeast regions saw the largest margin of growth at 19% and 15%, respectively.
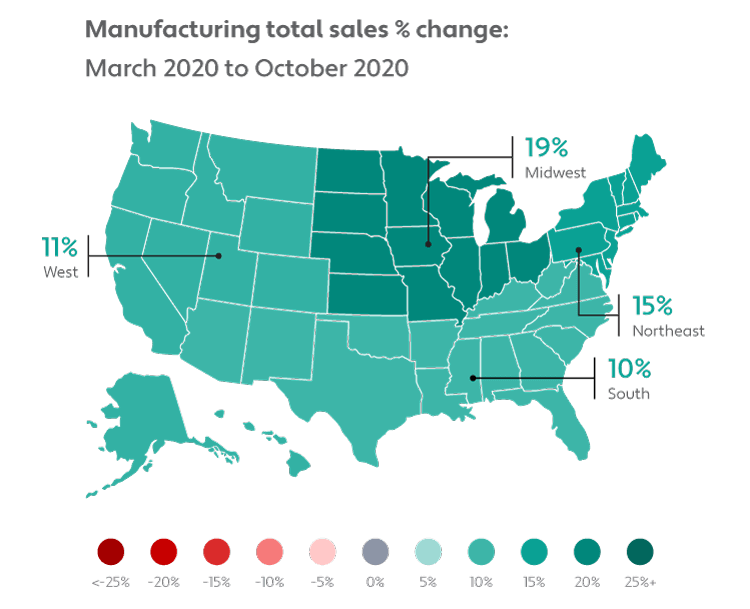
| Region | % change | March 2020 | October 2020 |
|---|---|---|---|
| Midwest | 19% | 102 | 122 |
| Northeast | 15% | 98 | 113 |
| West | 11% | 102 | 114 |
| South | 10% | 106 | 117 |

Avalara Retail Index
Total retail sales dropped significantly at the onset of the pandemic, recovered, and reached the highest levels in October as the holiday shopping season began.
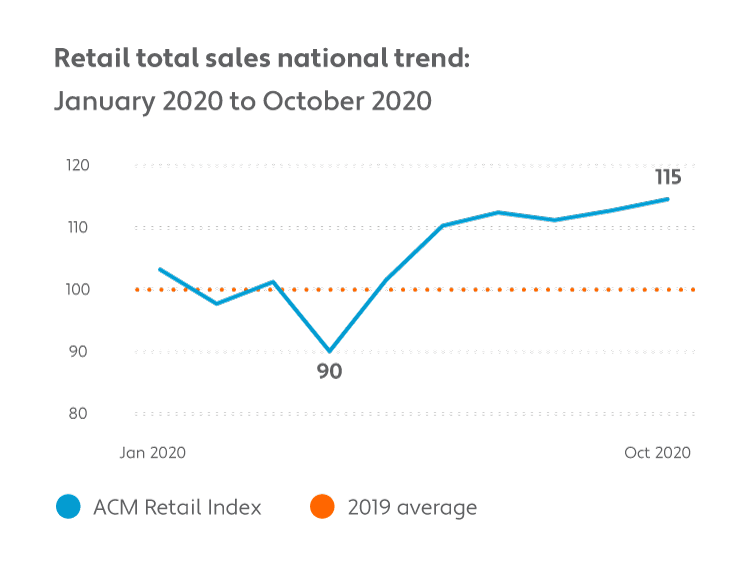
In March, stay-at-home orders and uncertainty around the pandemic prompted widespread retail store closures and prevented a regular cadence of in-person retail shopping. Avalara monitored transaction data in March and April to understand the immediate impact of the pandemic and found that ecommerce purchases began to rise and purchases of products for use at home became hot commodities. For example, our data shows that the rate of transactions for home improvement supplies grew by 118% in March compared to pre-pandemic transactions. Similarly, the rate of transactions of hobby supplies, like arts and crafts, collectible car parts, and drones, rose by 482% in April, in comparison to pre-pandemic transactions.
In April, total retail sales declined 10% from the baseline. Afterward, total retail sales began to rebound throughout the summer, reaching a peak of 15% above baseline in October. The uptick in retail total sales in October followed the year-to-date high for manufacturing total sales in September — pointing to the start of a strong holiday season. However, retail sales did see a drop below baseline levels in August at the same time the U.S. Bureau of Economic Analysis reported a 2.7% drop in personal income among Americans.
Regionally, our data shows that retail sales have recovered well across the U.S. When comparing October sales to March, the Midwest and Northeast regions saw an increase of 18% and 17% in total retail sales, respectively. This positive growth comes as the U.S. Department of Commerce reported an increase of 5.7% in year-over-year U.S. retail sales.

| Region | % change | March 2020 | October 2020 |
|---|---|---|---|
| Midwest | 18% | 102 | 120 |
| Northeast | 17% | 97 | 113 |
| West | 14% | 100 | 114 |
| South | 9% | 104 | 113 |

Avalara Services Index
Total sales in the services sector have risen and fallen multiple times throughout the year as COVID-19 cases waxed and waned.
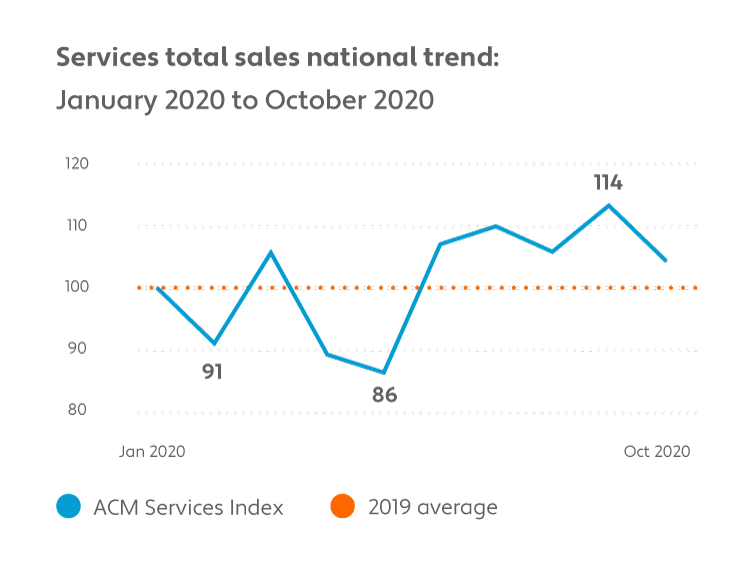
When in-person interaction came to a screeching halt in March and April, the services sector was impacted tremendously. Many of the services most people regularly rely on were forced to close their doors indefinitely, including businesses like hair salons and restaurants.
Similarly, as COVID-19 cases have increased and decreased across the country, the Services Index showed a correlation in total services sales. Following upticks in COVID-19 cases in April, July, and October, total sales decreased.
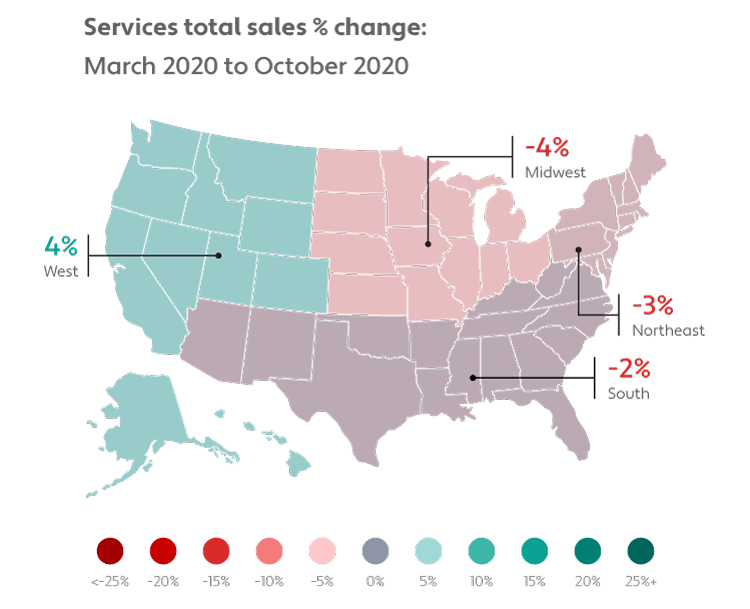
On a regional level, the Northeast, South, and Midwest regions of the country saw anywhere from 2% to 4% in decline of total sales between March and October. The West was the outlier with 4% growth in total sales in the Services Index between March and October.
| Region | % change | March 2020 | October 2020 |
|---|---|---|---|
| West | 4% | 101 | 105 |
| South | -2% | 110 | 108 |
| Northeast | -3% | 105 | 103 |
| Midwest | -4% | 105 | 101 |
Methodology
Who is included in the Avalara Commerce Monitor?
The Avalara Commerce Monitor report is intended to be an indicator of U.S. economic activity across the manufacturing, retail, and services industries. The Avalara Commerce Monitor does not provide insights or forward-looking predictions with respect to Avalara's revenue growth. Each index within the Avalara Commerce Monitor comprises a set of 400 Avalara customers.
Construction of the index began by identifying three groups of 400 Avalara AvaTax accounts to represent the three industries tracked by the Avalara Commerce Monitor: manufacturing, services, and retail. Criteria for which Avalara accounts to include in these cohorts were based on two priorities: data quality and optimizing the index to be representative of the U.S. economy.
The first criterion was that included accounts needed to be active users of AvaTax in all reported periods. The goal here was to ensure that index trends were driven by transaction growth and not by subscription adjustments (new onboardings, cancellations, etc.). This list started with all accounts that have had an active AvaTax subscription every month since January 2019. To make sure all of those subscriptions were fully live on the product, the list was then whittled down to users whose usage was within two standard deviations across all months in 2019.
After segmenting the still eligible accounts by industry, the remaining criteria focused on creating cohorts representative of the U.S. economy on two aspects: 1) sales generated by companies in each region, and 2) the number of businesses by company size (market segment). While the distribution of Avalara customers does not align perfectly with U.S. distribution (e.g., Avalara customers over-index on SMBs), accounts were selected to mimic U.S. distribution as closely as possible.
Account segmentation summary
Manufacturing cohort
Number of businesses by company size
| Region | Avalara distribution | U.S. distribution |
|---|---|---|
| Northeast | 20% | 20% |
| Midwest | 27% | 27% |
| South | 31% | 30% |
| West | 22% | 23% |
Amount generated by companies in each region
| Segment | Avalara distribution | U.S. distribution |
|---|---|---|
| ESB <20 | 7% | 12% |
| SMB 20-500 | 27% | 24% |
| UMM + Enterprise 500+ | 65% | 64% |
Retail cohort
Number of businesses by company size
| Region | Avalara distribution | U.S. distribution |
|---|---|---|
| Northeast | 27% | 24% |
| Midwest | 21% | 20% |
| South | 29% | 36% |
| West | 23% | 20% |
Amount generated by companies in each region
| Segment | Avalara distribution | U.S. distribution |
|---|---|---|
| ESB <20 | 13% | 12% |
| SMB 20-500 | 27% | 24% |
| UMM + Enterprise 500+ | 60% | 64% |
Services cohort
Number of businesses by company size
| Region | Avalara distribution | U.S. distribution |
|---|---|---|
| Northeast | 21% | 23% |
| Midwest | 24% | 20% |
| South | 31% | 35% |
| West | 24% | 22% |
Amount generated by companies in each region
| Segment | Avalara distribution | U.S. distribution |
|---|---|---|
| ESB <20 | 11% | 12% |
| SMB 20-500 | 22% | 24% |
| UMM + Enterprise 500+ | 66% | 64% |
Moving forward, accounts will only be removed from the index if their AvaTax subscription is canceled. In case of churn, the account would be replaced from an already established pool of eligible accounts not already included in the index.
AvaTax, Avalara’s automated tax calculation system, processes billions of transactions every year. The Avalara Commerce Monitor converts that data into anonymized indices to track the changes in commerce in the United States. The Monitor includes indices for each of three major industry segments: manufacturing, services, and retail. The growth of these segments is measured through two metrics: the quantity of items sold and total sales value.
Following the lead of established reports such as the Consumer Price Index (CPI), the Avalara Commerce Monitor uses indexing as a tool for representing growth over time. The CPI measures currency inflation by following the price of a “basket” of consumer goods. To measure that change, the current price of that basket is compared to how much it would have cost during a "base period," currently set as the baseline price of those goods from 1984-86. Similarly, the Monitor measures changes in U.S. commerce by comparing recent transaction data with monthly averages from 2019. To simplify the output of that comparison to focus on growth, both the CPI and the Monitor are multiplied by a base value of 100.
Cost of basket in June 2020
Average cost of basket 1984-86
That month’s index score
Cost of basket in June 2020
Average cost of basket 1984-86

That month’s index score
Total sales in June 2020
2019 monthly average
That month’s index score
Total sales in June 2020
2019 monthly average
That month’s index score
For May 2020, the Manufacturing Index has an items sold index score of 83, showing its growth relative to prior periods. Since 100 represents the monthly baseline of 2019 transaction data, we can say that for the services industry, 17% fewer items were sold compared to the 2019 monthly baseline. When that score rises to 104 in June 2020, we can say that items sold were up 25% for the services industry compared to May’s score of 83.
Index methodology details
Baseline
Baseline performance is calculated using 2019 data. Since the update cadence is monthly, the baseline for each metric is the average monthly sum of that metric in 2019. For example, for the retail cohort, the total sales baseline would be the average of the 12 monthly sums of total sales.
Outlier management
In order to remove noise, outliers have been removed from all data. For a given month and state (where “ship to” address is located), a metric’s daily sum is calculated, and the top 10% and bottom 10% of daily sums removed. Then the rest of the daily sums were added up to become the new monthly sums of that month in that state.
For example, for the retail cohort in June 2020 in the state of California, 30 daily sums of items sold were calculated, and the top 10% and bottom 10% of those 30 daily sums were then removed, with the sum of the rest of the daily sums to be the new monthly sum of items sold in California in June 2020 for the retail cohort. This outlier removal process is done for the combination of each cohort, metric, month, and state.

This method inevitably brings down the true monthly sums for all metrics, but since the interest here is the change between different months, rather than the real number, the index still properly represents the fluctuations of all metrics.
2020 calculation
The index value for 2020 shows a comparison between the given month in 2020 and the baseline performance of 2019, for the given metric.
Take the West region for the retail cohort for example. 2020 June’s monthly index for items sold is:
2020 June monthly sum of items sold
2019 items sold monthly average
About Avalara
Avalara helps businesses of all sizes get tax compliance right. In partnership with leading ERP, accounting, ecommerce, and other financial management system providers, Avalara delivers cloud-based compliance solutions for various transaction taxes, including sales and use, VAT, GST, excise, communications, lodging, and other indirect tax types. Headquartered in Seattle, Avalara has offices across the U.S. and around the world in Brazil, Europe, and India.
Avalara serves businesses across the U.S. and around the world. Additional insights like this can be found on our blog.


